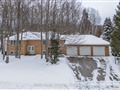
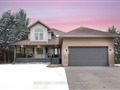
8 Templeton Dr
$708,972
Comparative Market Analysis
Feb 23, 2025
NOT AN ACTIVE LISTING
Historical Performance
| Period | $ Change | % Change |
| 1 Day | +$247 | +0.035% |
| 7 Days | +$296 | +0.042% |
| 30 Days | -$885 | -0.125% |
| 3 Months | -$1,643 | -0.231% |
| 6 Months | +$11.9k | +1.71% |
| 1 Year | -$30.9k | -4.17% |
| 3 Years | +$134k | +23.3% |
| 5 Years | +$228k | +47.6% |
| 10 Years | +$387k | +120% |
List My Property
Real Estate Statistics
Financing Solutions
AS SEEN ON


Are You a Licensed Real Estate Agent or Broker?