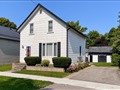
281 John St
$485,211
Comparative Market Analysis
Jun 15, 2025
NOT AN ACTIVE LISTING
Historical Performance
| Period | $ Change | % Change |
| 1 Day | +$169 | +0.035% |
| 7 Days | +$245 | +0.050% |
| 30 Days | -$404 | -0.083% |
| 3 Months | -$492 | -0.101% |
| 6 Months | +$9,402 | +1.98% |
| 1 Year | -$18.5k | -3.66% |
| 3 Years | +$102k | +26.5% |
| 5 Years | +$176k | +56.9% |
| 10 Years | +$318k | +190% |
List My Property
Real Estate Statistics
Financing Solutions
AS SEEN ON


Are You a Licensed Real Estate Agent or Broker?