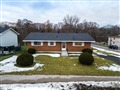
220 John St
$644,353
Comparative Market Analysis
Jun 15, 2025
NOT AN ACTIVE LISTING
Historical Performance
| Period | $ Change | % Change |
| 1 Day | +$225 | +0.035% |
| 7 Days | +$410 | +0.064% |
| 30 Days | -$30 | -0.005% |
| 3 Months | +$1,812 | +0.282% |
| 6 Months | +$19.7k | +3.16% |
| 1 Year | -$6,717 | -1.03% |
| 3 Years | +$130k | +25.3% |
| 5 Years | +$204k | +46.3% |
| 10 Years | +$369k | +134% |
List My Property
Real Estate Statistics
Financing Solutions
AS SEEN ON


Are You a Licensed Real Estate Agent or Broker?